Introduction :
This article is inspired by the work done by, David Porco and Louis Deharveng (National Museum of Natural History - France) who use the genetic tool and who were kind enough to send me documents relating to their work on springtails. Access to these requires knowledge that the neophyte does not necessarily have, which is why my approach to the object and nature of “barcoding” remains very summary.
General about cell :
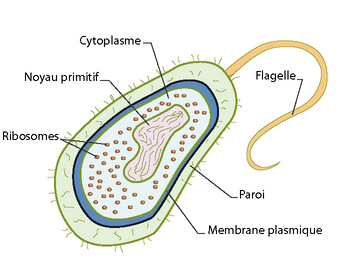 There are two major groups of cells, eukaryotic cells and prokaryotes*. Prokaryotes (opposite) are bacteria or archaea that have a cell wall and, in most cases, circular DNA (closed, with no free end) but do not have a nucleus, which distinguishes them from cells prokaryotes. The latter are those that make up the human body and, more broadly, the organisms of the four major kingdoms of life (Animals, Plants, Fungi, Bacteria). Let's take a closer look at them.
In addition to the nucleus, they consist of structures (organelles) that play important roles. The plasma membrane (plasmalemma) envelops the cytoplasm (made up of 80% water) and delimits the cell from its environment. The nucleus stores and protects most of the DNA. In its center is a dense zone (nucleolus), seat of the transcription of rRNA (Ribosomal RNA) used in the production of ribosomes.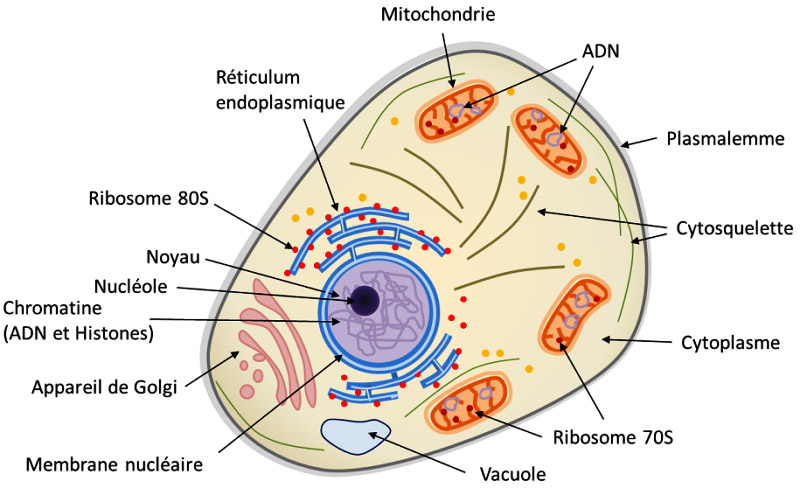 RNA (ribonucleic acid) is a molecule synthesized in the cell from a DNA template. It corresponds to a kind of copy of the latter used to convey information in the production of proteins. RNA performs other functions related to the chemical reactions of cellular metabolism.
Ribosomes are structures that are used to make proteins in the cell. They are located in a compartment called Endoplasmic Reticulum.
The mitochondria, to which I will return, are the main site of cellular respiration. They ensure energy production by breaking down sugars and lipids.
The vacuole maintains the balance inside the cell. It manages the right concentrations of elements in the cytoplasm, by selectively storing them within its membrane. The ribosome is a complex that translates mRNA (messenger RNA) into proteins. For this, the mRNA is responsible for copying and transmitting the information contained in the genome.
Nuclear DNA :
DNA (deoxyribonucleic acid), present in the nucleus of the cell, contains the genetic information essential to the vital functions of the latter. All of this information constitutes the genome which carries all the data relating to morphology and physiological functions transmitted by heredity.
Below, diagram of chromosomes made up of basic proteins associated with DNA (known as nuclear) which is in the form of a macromolecule. The chromosome carries the information defining characters. For example, in men, height, eye color, hairline, risk factor for certain diseases, etc.
Nuclear DNA has an impressive size that exceeds one meter in length when developed. Indeed, it is made up of a number of very fine strands, coiled in a particular arrangement, associated with each other in the form of pairs made up of elements called nucleotides (deoxyribonucleotides). The latter, which constitute the basic element of DNA and RNA, are identified by the letters* A-T and G-C. In humans, there are 46 strands, united in 22 pairs, to which is added a pair of chromosomes defining the sex (XX or XY).
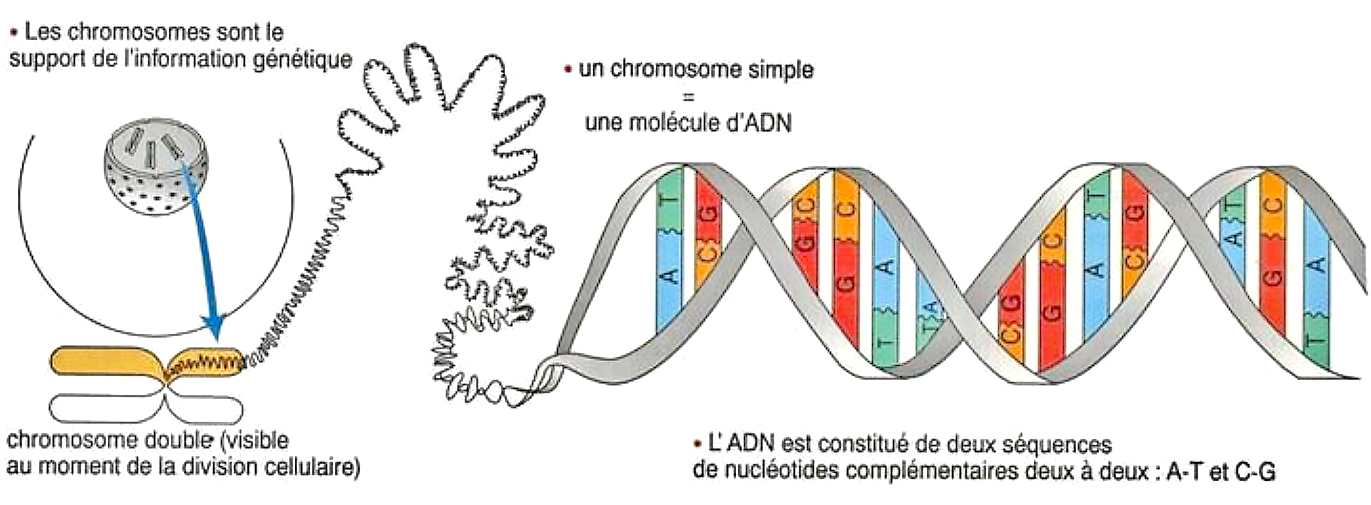
* Desoxyribonucleotides (nucleotides) are four in number. DAMP whose nucleic base is adenine (A), dGMP, whose nucleic base is guanine (G), dTMP, whose nucleic base is thymine and dCMP, whose nucleic base is cytosine.
Mitochondrial DNA :
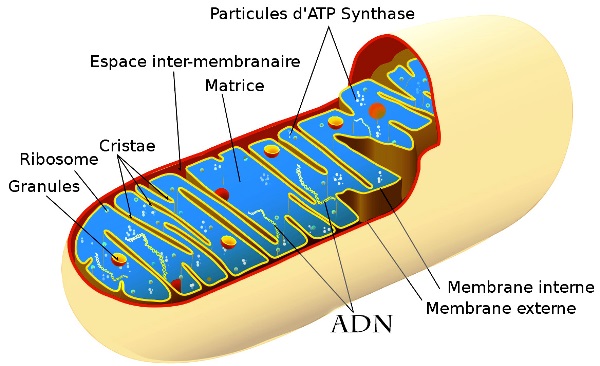
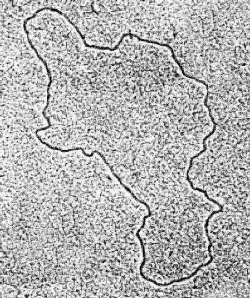
It is in the form of a circular molecule which essentially encodes the RNA proteins (ribosomal and transfer) specific to the functioning of the mitochondria.
Smaller in size than nuclear DNA, that of humans carries 16,569 pairs of nucleotides (nuclear DNA carries more than 3.3 billion).
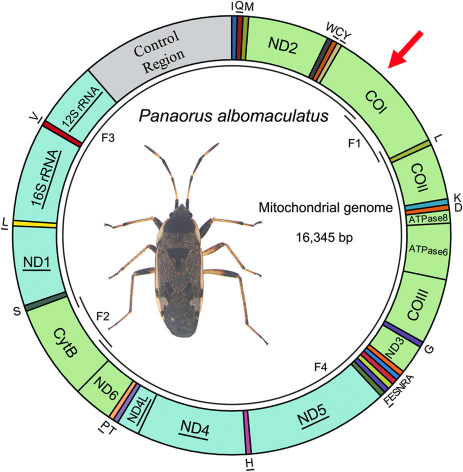
Below is a map of the mitochondrial genome of a Hemiptera, on which we can see divisions that each correspond to a gene (a gene being a portion of the genome, in other words a segment of DNA). In the case of this insect, thirteen of these genes are coding for the protein (this is the case of COI which I have marked with a red arrow).
* RNA: Ribonucleic acid. Molecule synthesized in cells from a DNA template. It corresponds to a kind of copy of the latter used to convey information in the production of proteins. RNA fulfills other functions relating to the chemical reactions of cellular metabolism.
Below, a map of the mitochondrial genome of a hemipterus on which we distinguish divisions each corresponding to a gene. In the case of this insect 13 of these genes are coding for the protein (this is the case of CO1 marked with a red arrow).
The DNA of living beings has the same type of basic structure, ie: two strands each made up of an ordered succession of several thousand nucleotides.
On the other hand, depending on the species, we can see differences such as:
- The number of DNA molecules in a cell.
- Its length (a few thousand to several billion nucleotides)
- Its shape (linear or circular)
- Its location (nucleus, mitochondria or cytoplasm)
But, it is above all the position of the nucleotides (A, G, T, C) called "sequence" which characterizes the genetic information. As we will see, mitochondrial DNA is more particularly used for genome sequencing because of its intrinsic properties, including the fact that it is 5 to 10 times more specific than the nuclear genome.
Note: The so-called coding DNA regions, which are those whose code is involved in protein synthesis, are called genes, the other DNA regions are called non-coding (in humans, these cover 98% DNA)
Taxonomy and DNA barcode :
Despite the appearance of genetic identification techniques on the basis of the DNA barcode, biologists still predominantly define species using determination keys derived from the observation of their common characteristics, starting from the most general to the more particular. This work requires the collection of live specimens or sufficiently well preserved to allow to list exhaustively their morphological details. The use of the DNA barcode is mainly used in laboratories specialized in genetics. The new species are therefore primarily the subject of detailed morphological descriptions even if more and more their bar code completes this description.
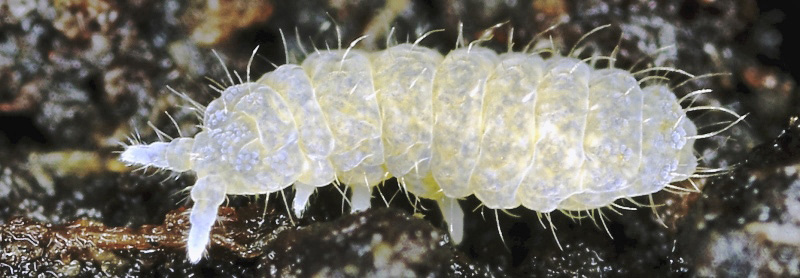
Below, photograph of a springtail Deutonura sp. (subfamily: Neanurinae).
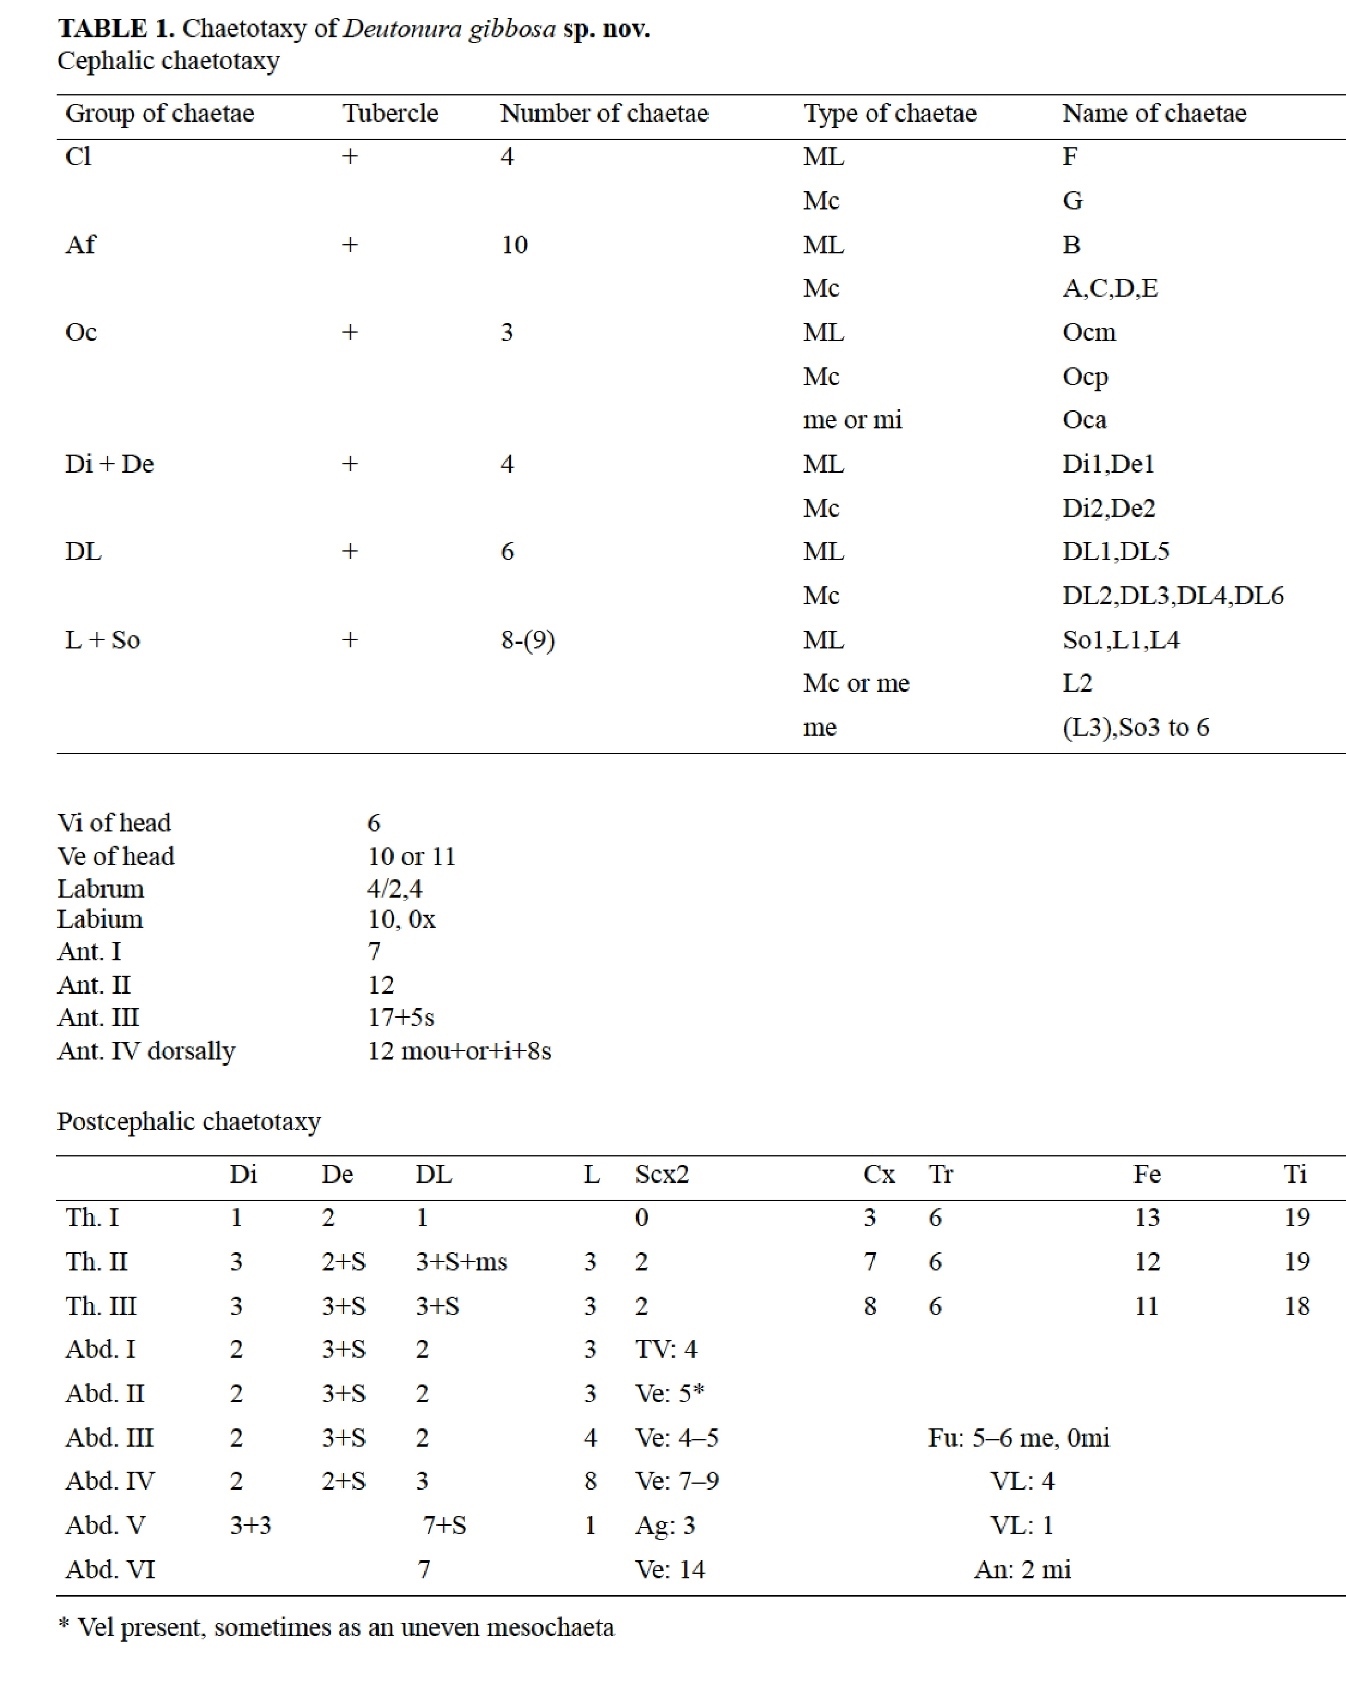
Here is an example of a description of morphological features for a new species of springtail Deutonura gibbosa (Porco, Bedos & Deharveng, 2010) belonging to the subfamily Neanurinae, within the family Neanuridea (Poduromorph).
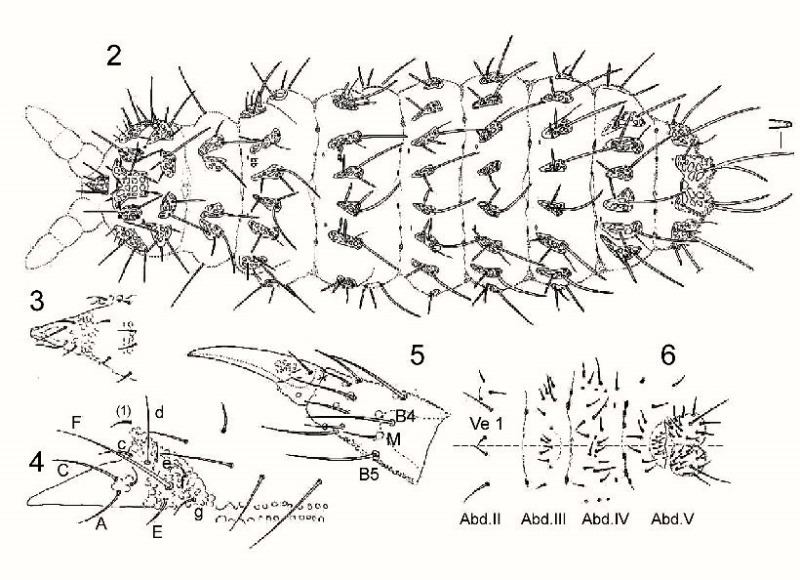
In traditional taxonomy, each morphological detail is listed in the form of an inventory comprising drawings and summary table according to a specific abbreviated terminology.
In the presented case of Deutonura gibbosa sp.nov hairs are identified according to:
- Their nature: ML (macroseta long), MC (short macroseta), Me (mesosetae), Mi (microsetae)
- Their implantation: Th.I (thorax, segments I), Abd.4 (abdomen, segment IV), Ant.2 (antenna, second segment) etc ...
- Their number.
On the following plate different parts of the body are represented to list the implantation of the hairs: fig.2: Dos / fig.3: Labrum / fig.4: Labium / fig.5: tibio-tarsus and claw of the leg 1 / fig.6: belly in the abdomen. (Review articles "morphology and physiology").
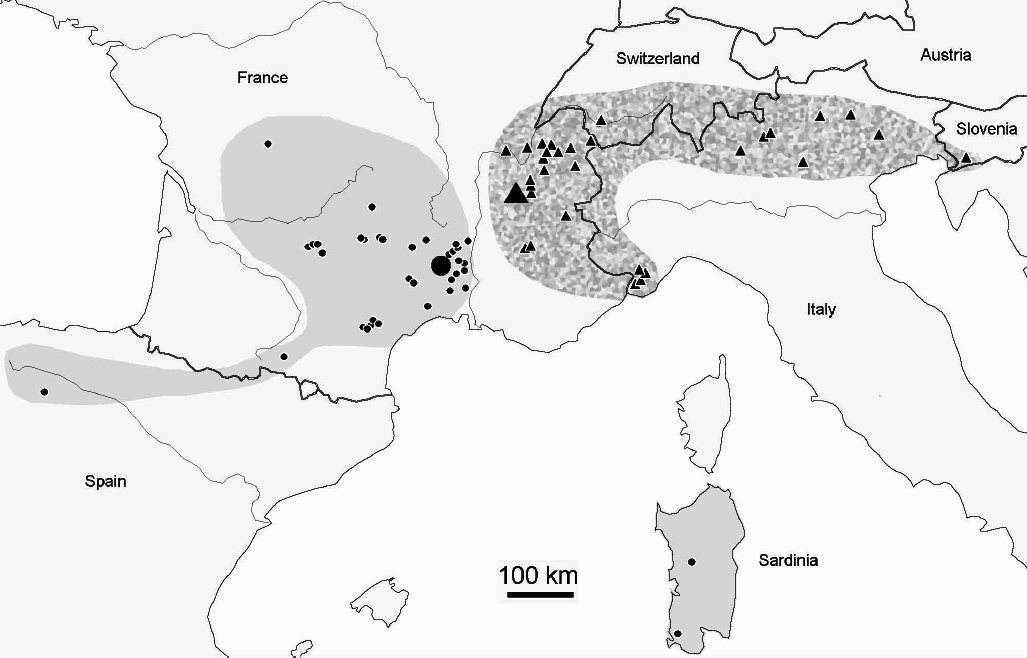
There are also maps showing geographical distributions of species, along with a list of places and the number of specimens collected.
Although they are documented, these identification keys remain incomplete because they do not make it possible to highlight diversities other than morphological, so-called cryptic* diversity. In addition, the lack of dedicated human resources within the scientific community considerably slows the progress of this work. In this regard, we can notice that the invertebrate animals that gather insects, arachnids, springtails, etc. are so diverse that it is estimated today that 80% of them are still unknown to us.
* Cryptic species. Genetic individualization for morphologically indissociable specimens has been demonstrated in a study (James et al., 2010) that shows that the description of Lumbricus terrestris (earthworm) actually applied to two species. distinct Lumbricus terrestris and Lumbricus herculeus. (Decaëns al., 2013) estimate that 30% on average of the species defined according to their morphology would be complexes of cryptic species. Another study (Janzen et al., 2013) shows that 32 species of morphologically described butterflies, Saturnidae, actually represent 49 genetically distinct species. These only examples illustrate the new risk that is called "biological chimera" that would reduce several true species to a single denomination.
DNA barcode :
In order to go further in the taxonomic approach, researchers have addressed this issue in terms of genetics. On this occasion, they noticed that it was not necessary to sequence the entire DNA chain of a specimen to be able to discriminate its species. Indeed, they discovered that the analysis of portions (sequences) of this long chain was sufficient (see below)
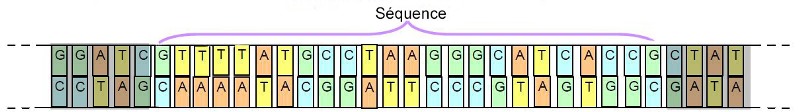
Important: To define this sequence, we must however identify one that varies from one species to another while remaining stable for the same species.
Since the mid-1980s, bacteriologists have used genetic sequencing as part of their diagnoses of bacterial infections (legionellosis, some forms of meningitis, etc.). The sequenced gene being 16S ribosomal RNA. To learn more, click here (PDF download).
In 2003, Paul Herbert (Director of the Biodiversity Institute of Ontario) and his team focused their research on sequencing a gene (a defined portion of DNA that corresponds to a basic unit of heredity) from a specific region of DNA present in the mitochondrial genome of eukaryotic cells. This portion of DNA that has become an identification standard corresponds to a part of the gene that encodes the "subunit 1 of cytochrome C Oxidase", a protein named CO1 (located in the zone marked with a red arrow on the second diagram of the paragraph "mitochondrial DNA") it constitutes a portion of the code of an enzyme "Cytochrome c Oxidase" essential to the biochemistry of the respiratory chain.
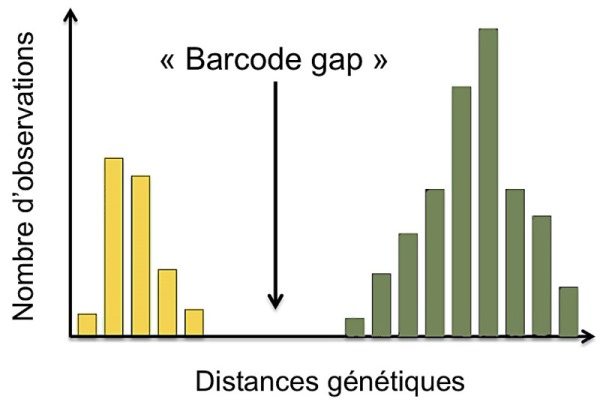 Definition: The genetic distance is an index (numerical value) proportional to the number of differences that exist between two sequences of the same gene fragment and which can take into account different models of evolution.
For example, the illustration to the right shows a significant difference in genetic distances, in yellow for individuals of the same species (intra-specific) and in green for individuals belonging to different species (inter-specific).
The CO1 gene chosen by Herber, while meeting the aforementioned first necessity, also has other advantages, such as, for example, its high rate of evolution and the fact that it allows an appreciable accumulation of mutations within an species. It appears by DNA sequence comparisons that the CO1 gene diverges sufficiently to allow discrimination of species, or even discrimination of populations within the same species (Cox and Hebert 2001-Wares and Cunningham 2001). In addition, since it is already very present in the cell which has between 300 and 2000 mitochondria and also in the form of copies (from 5 to 10) in the mitochondria itself, it is relatively easy to multiply, by a technique Biochemical complex called "PCR amplification" (Polymerase Chain Reaction). This method makes it possible to obtain a very large number of copies (100 to 10,000) of a given DNA sequence in order to have a sufficient quantity allowing the machines to perform the sequencing.
Investigative tool :
The use of the DNA barcode appears today as a tool that greatly expands the field of investigation of biologists. While classical taxonomy shows its limits, in that it requires studying intact specimens, the genetic study accommodates various states such as eggs or larvae but also fragments of corpses, excrement , mucus or other traces present in various substrates (this is referred to as intracellular DNA analysis and extracellular DNA analysis). Thus, the analysis of the water of a pond can reveal that a given species of frog evolved there, even if this frog could not be physically taken there.
The DNA Barcode also paves the way for historical reconstruction, both in terms of the separation mechanisms of two species and in the evolution of their geographical distribution (phylogeography). In this regard, D.Porco et al. (2013) showed how European Springtails introduced into North America have become invasive.
Note: There are many cases* of species introduced accidentally, particularly through trade between continents. Their character is often invasive because of the absence of natural predators, sometimes leads to consider introducing these ... not without risks!
The use of the DNA barcode also makes it possible to highlight the predatory behaviors of certain species through the analysis of their diets, by sampling the contents of digestive tubes or droppings. These studies shed new light on prey / predator or host / parasite interactions.
The DNA barcode that can be reproduced as needed allows for massive analysis with considerable time savings compared to the morphological identification of which we have seen the limits. It also makes it possible to carry out this work from states little or not described by the traditional taxonomy.
This technique, however, has its own limitations. Indeed, researchers have sometimes found genetic similarities on morphologically distinct specimens or, for geographically isolated populations where the same species may have a high genetic variability. To support their conclusions, scientists cross the results of the DNA barcode with other identification data.
* I met Leptoglossus occidentalis, for which I had felt the need to publish an article on a local site, but we can also cite many others known to all: The turtle with red gills or Florida threatens the European pond turtle whose habitat it competes for, the gray squirrel that supplants our red squirrel, the Asian hornet killer bee, the tiger mosquito, catfish in our ponds, etc ...
DNA sequencing :
The preparation of the sequencing requires a succession of steps which consists of a destruction of the tissues followed by a purification and an "amplification" carried out in the form of a protocol which governs a series of physicochemical operations:
- Extraction of the DNA from a selected sample taken from the organism to be studied.
- Start of PCR amplification and follow-up of the various chemical reactions that take place there.
- Purification by trapping and exclusion of residual particles that may disrupt sequencing.
- Isolation of the strand sequence by capillary electrophoresis based on a spectral analysis of the fluorescence of the 4 markers (fluorochromes)
- Recovery of the mitochondrial sequence by measuring the fluorescence on a CCD sensor then corrections (spatial and spectral calibration) and data collection in computer form.
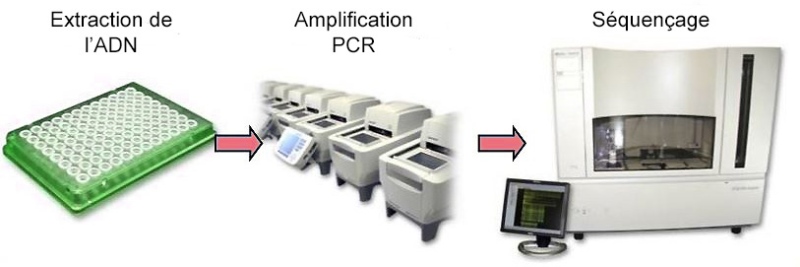
Performed in the laboratory by automated machines, the sequencing is performed from a test tube containing DNA, nucleotides and DNA polymerase primer (from the PCR amplification mentioned above).
 I can not detail here the complex synthesis reactions that take place in this tube. It may be noted that spectral analysis is possible only by means of the labeling with different fluorochromes (green A, red T, yellow G and blue C), each color occupying distinct wavelength ranges. During the restitution of the analysis, each nucleotide thus appears in a succession corresponding to its order within the analyzed sequence.
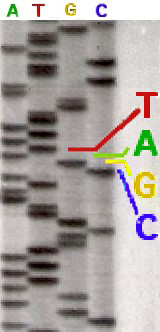
The radioactive label that was originally used did not distinguish one nucleotide from the other three. It was then necessary to sequence from four different tubes, each having a type of nucleotide. Sequencing with radioactive labeling could be read directly to the eye on an acrylamide gel (opposite).
Nowadays, the replacement of the radioactive marking by fluorochromes allows the realization of the four reactions within the same tube. Modern sequencers detect fluorescence intensities and have software that can translate results graphically, as can be seen in the example below.
On the upper part, we note the succession of nucleotides identified by their letter and accompanied by numbers that allow to locate them within the sequence studied. On the lower part, the four-color curves correspond to the amplitude (intensity) of the fluorescences measured for each of the markers.
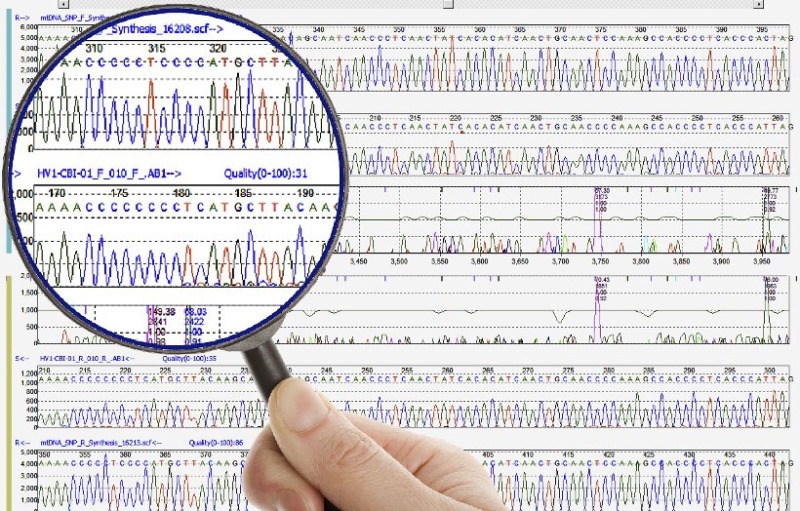
Beyond this type of presentation, all the information is also recorded in tables using an international nomenclature that allows automated comparisons with existing databases.
Data base :
Genetic databases become crucial in biology, so the publication of a scientific article describing a biological sequence is subject to the prior filing of its genetic data on one of the following three bases:
Genbank (USA). Natural center for Biotechnology Information
EMBL (Europe). Nucleotide Sequence Database
DDBJ (Japan). Data Bank of Japan
The number of entire sequences or genomes deposited there increased exponentially between 2000 and 2014, while at the same time the costs of sequencing decreased in similar proportions, making it easier to use such techniques.
Today, there are hundreds of databases, which led to the creation of a database of databases: NAR database
As an indication, in September 2012 the nucleic databases counted 31,907,138 entries for invertebrates alone, for a total of 52,527,673,643 nucleotides!
In the specific case of the code-bar DNA, there is for example a database managed by International Barcode of Life which at 02/05/2018 had in its platform BOLD bioinformatics a set of more than 6 million codes -barre DNA, of which, for the animal kingdom, 4,367,942 barcodes representing 154,271 species and from 238 countries. This platform also has tools to compare the DNA sequence of an unknown organism to the set of DNA bar codes listed in the database.
Example of study :
Let's continue the example of Deutonura gibbosa sp.nov (Porco-Bedos & Deharveng, 2010) mentioned above for which these researchers carried out a DNA barcode study.
The genus Deutonura with more than 56 species is one of the main representatives of the large subfamily Neanurinea which has a total of 784 (last updated 28-03-2018). While some species such as Deutonura phleagea (Caroli, 1912- Cassagnau, 1979) have a wide range, most of them have been observed in much smaller areas, some of which are narrow endemic species. The geographical distribution of Deutonera gibbosa sp.nov (very common species of the genus) covers the Alps and the south of the Jura.
Observation :
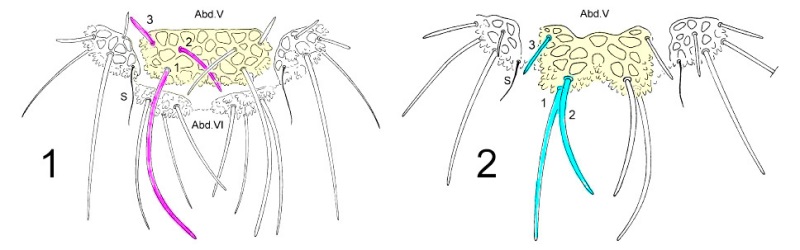
To disassociate species of the genus Deutonera, classical taxonomy mainly takes into account the arrangement of the dorsal tubercles as well as the number of hairs on each tuber. The observation of the two species, Deutonura deficienvers sylvatica (fig.1) and Deutonura gibbosa sp.nov. However, Fig.2 shows a similar implantation of the dorsal hairs and the same number by tubercles.
The only difference found, as shown in the sketch below, lies in a bilobation and an extension of the dorso-intern tubercle on Abd.V (in yellow), associated with a modification of the arrangement of the hairs and their lengths on this same tuber.
Sequencing :
The researchers sequenced 17 specimens of 5 species of the genus Deutonura (6 D.caerulescnens, 5 D.deficiens sylvatica, 1 D.decolorata, 4 D.gibbosa sp.nov and 1 D.vallespirensis). The measured genetic distances are shown in the tables below: Tableau.1 (interspecific), Tableau.2 (intraspecific).
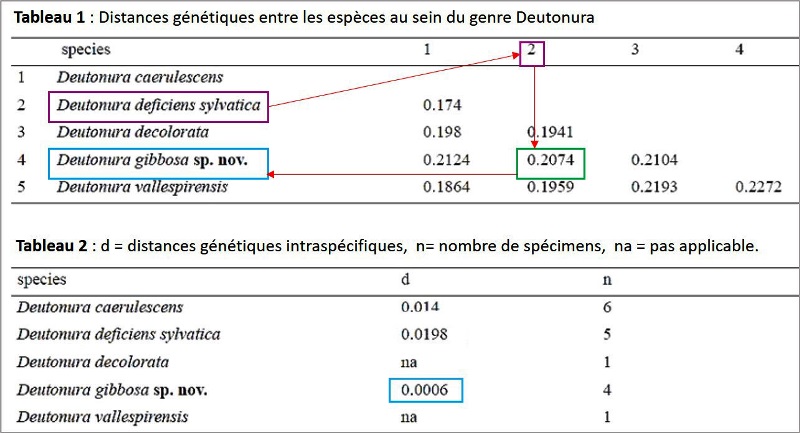
These values are also illustrated by the tree below, generated from a nucleotide transcription model called "K2P" (Kimura two parameters) on which the upper and lower sides of the dark triangles show the maximum genetic distances respectively and minimal within species.
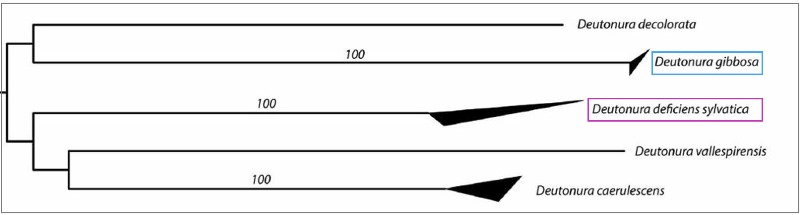
We actually visualize that Deutonura gibbosa sp.nov. (Barcoding performed with 4 specimens), has the lowest intraspecific value (0.0006) of the genus Deutonura while for its nearest neighbor, Deutonura deficienvers sylvatica, the measurement made from the 5 specimens, shows an interspecific distance of 0.2074.
These two intra and interspecific values ??as well as the distances characterizing the other species of this genus (Deutonura) provide genetic support to delineate Deutonura gibbosa sp.nov as a distinct mitochondrial line.
Conlusion :
As this example points out, the minimal morphological differences between two species D.gibbosa sp.nov. and D.deficiens sylvatica are markedly more marked genetically. This observation, made as early as 2010 with which recent studies converge, confirms the potential of the genetic tool with regard to the characterization of species. More widely, many species not yet described or that require in-depth reviews benefit from this contribution which increases reliability and accuracy. But the resources of the DNA barcode extend beyond the identification of species by impacting more generally the whole field of biodiversity.
Acknowledgment: I thank David Porco, author of the study on Deutonura, who has served as an example. It took some time to re-read this article and offer me fixes to make it more understandable.
Thanks : I warmly thank David Porco, author of the study on Deutonura, who has served as an example here. It took some time to re-read this article and offer me fixes to make it more understandable.
Sources :
• "Description and DNA barcoding assessment of the new species Deutonura gibbosa (Collembola: Neanuridae: Neanurinae), a common springtail of Alps and Jura" (D. Porco, A. Bedos & L. Deharveng. 2010.)
• "Amplification PCR- Ifremer" : http://www.bibliomer.com/
• Société Française d’Ecologie et d’Evolution : Article : "Le barcoding ADN" (T.Decaëns, D.Porco t R.Rougerie).
Images :
• Cellule : https://www.encyclopedie-environnement.org/vivant/symbiose-evolution-lorigine-de-cellule-eucaryote/
• Mitochondrie : https://fr.wikipedia.org/wiki/Mitochondrie
• ADN nucléaire : ADN et Chromosomes par L. Guibaud
• ADN mitochondrial
• Graphique ADN modifié à partir de: https://softgenetics.com/products/mutation-surveyor/
• Deutonura sp. : ©Ph.Garcelon.https://softgenetics.com/products/mutation-surveyor/